Waterloo is a special place for tech.
Our ecosystem’s tech credentials – especially in talent, business costs and research productivity – place us among North America’s most dynamic hubs and we can prove it. According to CBRE, we’re the top emerging tech talent market in North America and home to Canada’s highest-quality tech talent. According to Deloitte, the fastest-growing tech companies in Canada are right here in Waterloo.
Nothing speaks as clearly as cold hard data. We recently published data-driven comparisons between Waterloo and emerging US tech markets like Austin, Pittsburgh, Columbus, Salt Lake City, Detroit and Phoenix. The results? Waterloo won each match-up.
Since that series started, we’ve dug up more new data that makes apples-to-apples comparisons with Europe’s top tech hubs possible. Over the next two months, we’ll go head-to-head with new “5 Charts” articles about Berlin, London, Stockholm, Amsterdam and Munich.
How will Waterloo hold up against competition from Europe? We’ll see.
This is part of a Waterloo EDC series called “5 Charts: Waterloo Versus” that compares our community with some of Europe’s top tech hubs, including London, England; Munich, Germany; Berlin, Germany; Amsterdam, the Netherlands and Stockholm, Sweden. We also did a series comparing Waterloo to American tech hubs.
Match-up #2: Waterloo, Canada vs. Stockholm, Sweden
Quick Facts:

Waterloo and Stockholm share a handful of similarities. We both have an extremely high concentration of tech talent, offices from some of the biggest tech companies in the world and a top technology university. Don’t worry, we won’t make any ABBA and “Waterloo” jokes. We make for a good match-up.
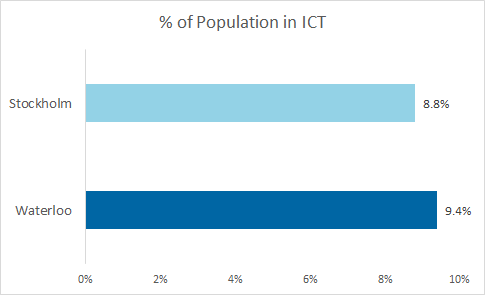
Round One: Percentage of Population Employed in the ICT Sector

SOURCE: Eurostat, Waterloo EDC
Wow – this one was close.
A common measure used in the annual CBRE Scoring Tech Talent report, percentage of the population employed in ICT demonstrates the density of an ecosystem. Based on CBRE and our own data, Waterloo has one of the highest talent densities in North America.
Within a 10km/6mi radius you’ll find the University of Waterloo – Canada’s top technology school – and about 500 startups. Also in that area: Canada’s top innovation hub (Communitech), Canada’s #1 private business accelerator (The Accelerator Centre), Canada’s most productive incubator (Velocity) and a business community that includes Google’s Canadian Engineering Headquarters and three new unicorns, Faire, ApplyBoard and Arctic Wolf.
Round Two: Startups per 100,000 People

SOURCES: Startup Genome, Nexten.io, and Conway calculations
Another standard measure of tech density, startups per 100,000 is also an interesting measure of entrepreneurship. Waterloo has the second most startups per capita in North America – behind only Silicon Valley.
Waterloo’s excellent tech support ecosystem makes it an ideal location for startups to thrive and the University of Waterloo – which produces 18% of Canada’s tech founders – drives our entrepreneurial culture.
Round Three: Patents per 100,000 People

SOURCE: European Patent Office (EPO)
Waterloo is the most patent-intensive community in Canada, producing 11 times the national average, and this standard measure proves it. In our US comparisons, we saw over and over that Waterloo can beat far larger communities on research output and patent production, even when not using per capita measures.
This is one of Canada’s most innovative communities.
Round Four: Tech Program Sizes

SOURCES: The University of Waterloo and Uppsala University
This should be an interesting match-up.
KTH Royal Institute of Technology and University of Waterloo (UWaterloo) are both globally significant engineering and technology schools producing some of the world’s top graduates. Unfortunately, the vast differences in the Canadian and Swedish post-secondary systems make a direct comparison challenging – it’s hard to compare a full-sized university like UWaterloo with KTH, which is much smaller and heavily focused on graduate studies (which we don’t normally capture in these articles).
For the chart above, we’ve compared UWaterloo to the largest computer science program we could find within 100km of Stockholm – the one at Uppsala University (ranked 234 for engineering and technology). It isn’t a perfect solution, but it clearly demonstrates UWaterloo’s incredibly high enrollment in computer science, especially considering the exceptional quality of UWaterloo’s program (23rd ranked) and overall strength in engineering and technology (38th ranked).
UWaterloo is also home to Canada’s largest engineering school and its tech-related program enrollment is larger than schools like Stanford University, Massachusetts Institute of Technology (MIT) and CalTech – to name a few. UWaterloo also has substantial graduate-level enrollment in engineering with 800+ graduate degrees granted annually.
Round Five: Rent Costs

SOURCE: Cushman & Wakefield (2016)
If there was one place where Waterloo has an unmatched advantage over other tech hot spots, it’s cost. That was consistently true in our US comparisons and it continues to be true with Europe. Finding the workspace to match your company’s growth plans without sacrificing top talent and access to markets, is all possible in Waterloo.
The numbers have spoken – Waterloo has significant advantages over Stockholm in talent, research productivity and business costs. Stay tuned for our next match-up with London! As per usual, we will continue to use the same measures for each comparison – we don’t need to cherry-pick numbers to compete.
If you like data and want a more detailed comparison, download our European Secondary Markets comparison.
