Waterloo is a special place for tech.
Our ecosystem’s tech credentials – especially in talent, business costs and research productivity – place us among North America’s most dynamic hubs and we can prove it. We recently published data-driven comparisons between Waterloo’s tech ecosystem and up-and-coming US tech markets like Austin, Pittsburgh, Salt Lake City, Columbus, Detroit and Phoenix. The results? Waterloo won each match-up.
Since that series started, we’ve dug up more new data that makes apples-to-apples comparisons with Europe’s top tech hubs possible. Over the next two months, we’ll go head-to-head with new “5 Charts” articles about Berlin, London, Stockholm, Amsterdam and Munich.
How will Waterloo’s stardom hold up in Europe?
Matchup #1: Waterloo, Canada vs. Berlin, Germany
Quick Facts:

Waterloo and Berlin have a lot in common. We both have a booming startup scene, providing attractive opportunities for investors, are known for our strong artificial intelligence hubs and possess a culture of knowledge-sharing and support from local tech leaders. We make for a good match-up.
Round One: Percentage of Population Employed in the ICT Sector

SOURCE: Eurostat, Waterloo EDC
Waterloo has one of the highest talent densities in North America – a trend that continues in Europe comparisons!
A lot contributes to Waterloo’s impressive talent density.
The University of Waterloo is Canada’s top technology school, graduating tech founders of recent unicorns, Faire, ApplyBoard and Arctic Wolf. Layer on Canada’s business-friendly immigration programs and 150+ cutting-edge research centres, and it’s no wonder why Waterloo consistently takes the win here.
Round Two: Startups per 100,000 People

SOURCES: Startup Genome, Nexten.io, and Conway calculations
Waterloo has the second most startups per capita in North America. The region coming out ahead of Berlin, Germany’s startup capital, really showcases our homegrown talent on a global stage.
Waterloo’s excellent tech support ecosystem makes it an ideal location for startups to thrive and the University of Waterloo – which produces 18% of Canada’s tech founders – drives our entrepreneurial culture.
Round Three: Patents per 100,000 People

SOURCE: European Patent Office (EPO)
Waterloo pulled way ahead in this round, with 150 patents granted per 100,000 people. Waterloo’s top research centres and incubators, and unique IP protection policies, make for an excellent environment for technology inventors and companies looking to drive their R&D capacity.
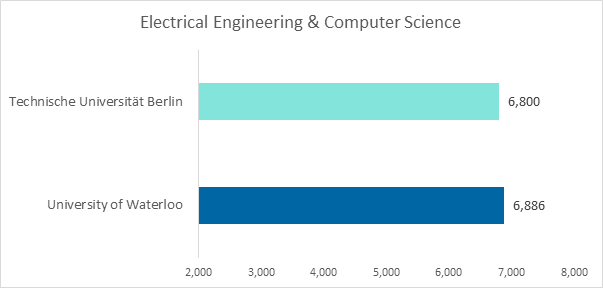
Round Four: Tech Program Sizes

SOURCES: The University of Waterloo and Technische Universität Berlin
UWaterloo narrowly wins this category! However, it’s worth noting that we had some challenges finding numbers for the Technische Universität Berlin because they include automotive systems, digital media/technology, computational neuroscience and information systems management within their Computer Science and Electrical Engineering department. If we included programs like those in UWaterloo’s numbers, we’d have a much higher number, but the lack of program alignment and/or offerings makes this direct comparison impossible.
That said, UWaterloo is home to Canada’s largest engineering school and its tech-related program enrollment is larger than schools like Stanford University, Massachusetts Institute of Technology (MIT) and CalTech – to name a few.
Round Five: Rent Costs

SOURCE: Cushman & Wakefield (2016)
If there was one place where Waterloo has an unmatched advantage over other tech hot spots, it’s cost. Finding the workspace to match your company’s growth plans without sacrificing top talent and access to markets, is all possible in Waterloo.
The numbers have spoken – Waterloo has significant advantages over Berlin in talent, research productivity and business costs. Stay tuned for our next match-up with Stockholm! As per usual, we will continue to use the same measures for each comparison – we don’t need to cherry-pick numbers to compete.
